As these statistics show, alcohol-impaired crashes contribute to many fatalities and economic costs in the U.S. each year.
Organizations like Mothers Against Drunk Driving (MADD) have brought national attention to the dangers of drunk driving. It’s illegal in every state in America to drive with a blood alcohol concentration (BAC) of 0.08 grams per deciliter or higher.
The government takes drunk driving arrests very seriously, with some states requiring first-time or repeat offenders to install ignition interlock devices, or car breathalyzers, in their vehicles.
While drivers are legally considered to be alcohol-impaired when they hit a 0.08% BAC level, the Centers for Disease Control and Prevention (CDC) reports that impairment to your driving — such as decreased reaction time — can occur with a BAC as low as 0.02%, which can be reached after about two drinks.
This article will explore some of the most devastating consequences of alcohol-impaired driving by reviewing drunk driving accident statistics reported by the U.S. Department of Transportation.

All of the statistics in this article can be found in the National Highway Traffic Safety Administration’s (NHTSA) “Traffic Safety Facts” publication of 2018 data.
Notable Statistics:
- In 2018, 10,511 people were killed in drunk driving car accidents.
- Over 1/4 of all drunk drivers involved in fatal accidents were between 25 and 34 years of age.
- Four times as many male drivers were involved in fatal drunk driving accidents as female drivers.
- Some amount of alcohol was involved in over 1/3 of all traffic fatalities.
Drunk Driving Fatalities
Some amount of alcohol was involved in over 1/3 of traffic deaths in 2018. Just under 30% (10,511 people) of all fatalities in motor vehicle crashes for the year were from accidents with at least one drunk driver (breathalyzer showing a BAC of 0.08% or greater). This means that, on average, someone was killed every 50 minutes.
Of the people killed in drunk driving crashes, 7,051 (67%) died in accidents where a driver had a BAC of 0.15% or greater, while 1,878 (15%) fatalities occurred when a driver had a BAC between 0.01% and 0.079%.
The most frequent blood alcohol content level among drunk drivers in fatal accidents was 0.16%. This is double the legal limit for a DUI or DWI.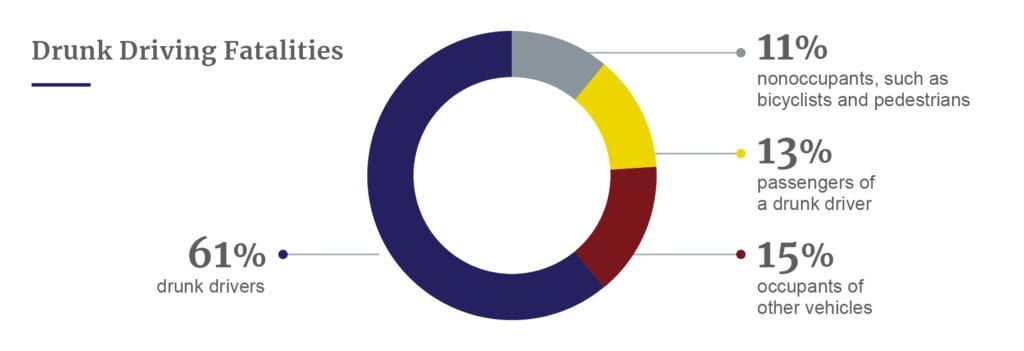 Drunk drivers themselves had the highest death rates, accounting for 6,364 (61%) of total fatalities.
The remaining people killed included:
- 1,389 (13%) passengers of a drunk driver
- 1,580 (15%) occupants of other vehicles
- 1,178 (11%) nonoccupants, such as bicyclists and pedestrians
Alcohol impairment is more of a contributing factor in single-vehicle crashes than multiple-vehicle crashes. Approximately 31% of all drivers killed in single-vehicle crashes had BACs of 0.08% or greater, whereas only 13% of drivers whose cause of death was a multiple-vehicle crash were alcohol-impaired.
Drivers in Fatal Alcohol-Related Crashes
The number of alcohol-impaired drivers in fatal accidents in each age group is listed in the chart below. Note that nearly 10% of these drivers were younger than the legal drinking age, meaning they were driving after underage drinking.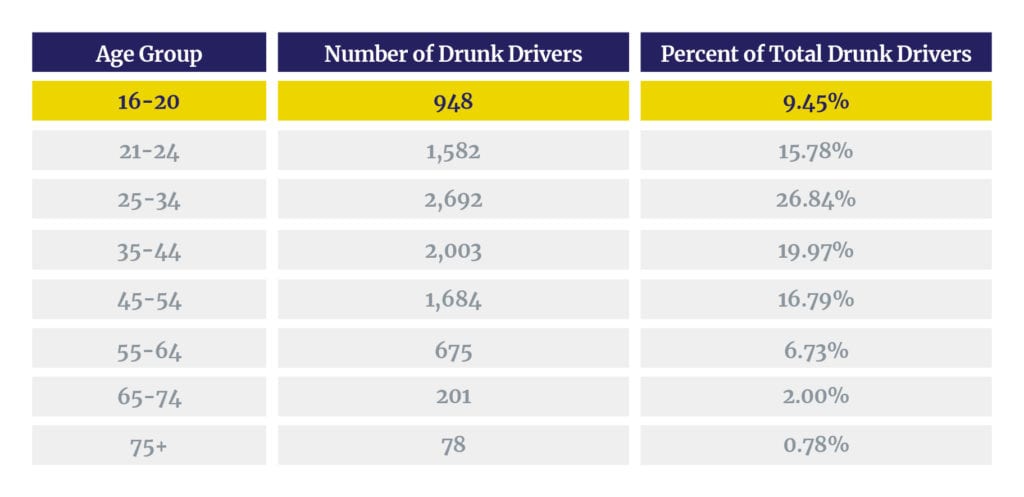
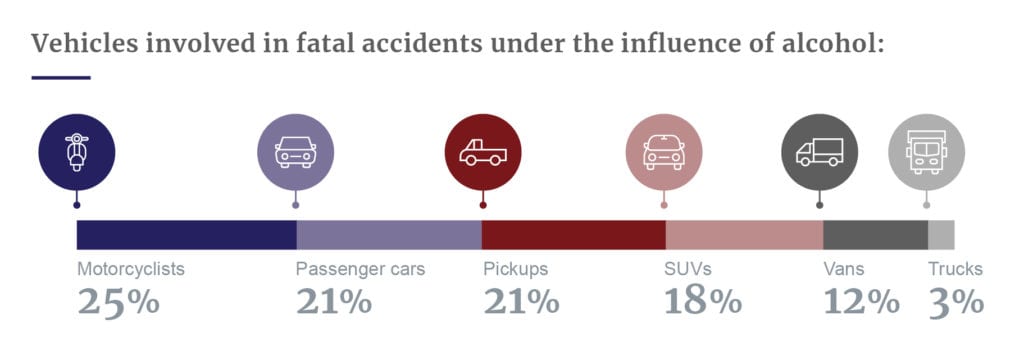
In 2018, 25% of motorcyclists involved in fatal accidents were under the influence of alcohol.In 2018, four male drunk drivers were involved in fatal motor vehicle crashes for every female drunk driver involved in one (7,698 males compared to 1,918 females).
The percentages for other types of vehicles include:
- 21% for passenger cars
- 21% for pickups
- 19% for SUVs
- 12% for vans
- 3% for large trucks
Drunk Driving Statistics by State
The number of people killed in motor vehicle traffic crashes in each state in 2018 ranged from 31 in Washington, D.C., to 3,642 in Texas. Texas also had the highest number of drunk driving crashes at 1,439.
The national average percentage of drunk driving fatalities compared to deaths in total traffic accidents was 29%. By state, percentages ranged from 43% in Montana to 19% in Kentucky and West Virginia.
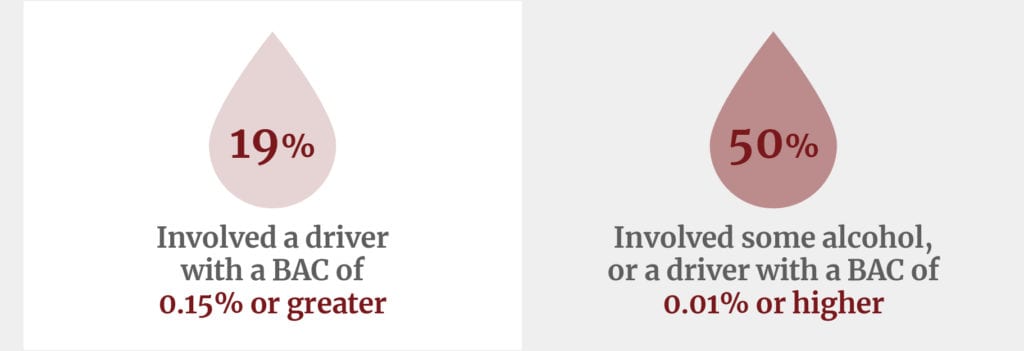
The national average percentage of fatal crashes that involved a driver with a BAC of 0.15% or greater was 19%, with state percentages ranging from 31% in Montana to 12% in Kentucky and West Virginia.
Nearly 50% of fatal accidents in Montana (48%), Texas (46%), Alaska (45%) and Connecticut (45%) involved some alcohol, or a driver with a BAC of 0.01% or higher.
BAC of Driver in Fatal Drunk Driving Accidents
For all of these states but Texas, it appears that the high percentage of alcohol-involved accidents may simply be the result of having a low number of total fatalities to begin with:
- 87 out of 182 in Montana
- 36 out of 80 in Alaska
- 132 out of 294 in Connecticut
This percentage seems to be a more meaningful statistic in Texas, where 1,673 out of 3,642 fatal accidents involved alcohol.
When Do Fatal Drunk Driving Crashes Occur?
In 2018, more drunk driving crashes involving fatalities occurred in June (9.3%), July (9.2%) and May (9.1%) than any other months.
Additionally, drivers involved in fatal car crashes were 3.4 times more likely to be intoxicated at night than during the daytime (31% compared to 9%). In fact, 75% of all fatal drunk driving accidents in 2018 — where the time of day was reported by law enforcement — occurred at night. Forty percent of all drivers killed in a nighttime single-vehicle crash were intoxicated.
Fatal car accidents on the weekend — from Friday at 6:00 p.m. to Monday at 5:59 a.m. — were also twice as likely to involve drunk drivers: 28% of all drivers involved in fatal weekend crashes had BACs of 0.08% or higher versus 14% on weekdays.
Economic Costs of Drunk Driving Crashes
2010 is the most recent year with available economic data about drunk driving accidents. In 2010, the estimated cost of all alcohol-impaired crashes in the United States, including both accidents involving alcohol-impaired drivers and intoxicated nonoccupants, was $44 billion.
This is approximately 18% of the total economic cost of car crashes for 2010, which was $242 billion.

These economic costs include all of the following:
- Loss of productivity
- Workplace losses
- Legal and court costs
- Medical expenses
- Emergency medical services
- Insurance administration costs
- Traffic congestion
- Property damage
However, when lost quality-of-life is included in the calculation, the amount of societal harm from drunk driving accidents skyrockets to $201.1 billion, which is just under 1/4 of the $836 billion in total harm done by motor vehicle traffic crashes.
If you or someone you love has been injured or killed by a drunk driver, you may be entitled to receive compensation. You should consult with a personal injury attorney near you as soon as possible to learn about your rights and options.