As Uber and Lyft have become more popular, you may wonder about the safety of rideshare apps. Read on for key rideshare accident statistics.
When you use a cellphone app to order an Uber or Lyft, you expect to be picked up and driven to your destination without incident.
Unfortunately, rideshare accidents occur more often than you think, and with more people choosing to work as Uber drivers and Lyft drivers, the number of accidents will continue to climb.
This article will discuss some statistics about the use of rideshare services in the United States and the types of rideshare accidents you could encounter the next time you need a ride.
Notable Statistics:
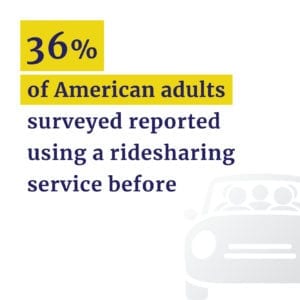
- As of 2023, 36% of American adults surveyed reported using a ridesharing service before.
- Uber reported 127 fatal car accidents and 153 fatalities in 2021 and 2022.(Latest Report)
- Researchers believe the introduction of ridesharing is at least partially responsible for a 3% annual increase in U.S. fatal accidents since 2010.
- The 3% increase attributed to ridesharing has resulted in 987 additional deaths each year.
Uber and Lyft Usage Statistics
Rideshare companies have taken the U.S. transportation market by storm. Since their introduction in 2010, the use of ridesharing services, such as Uber or Lyft, has consistently increased.
According to a 2018 Pew Research Center survey, 36% of American adults surveyed say they have used a ridesharing service before. Compare that with a similar study conducted in 2015, where only 15% of those surveyed said they had used a rideshare platform, and one-third of respondents had never even heard of ridesharing.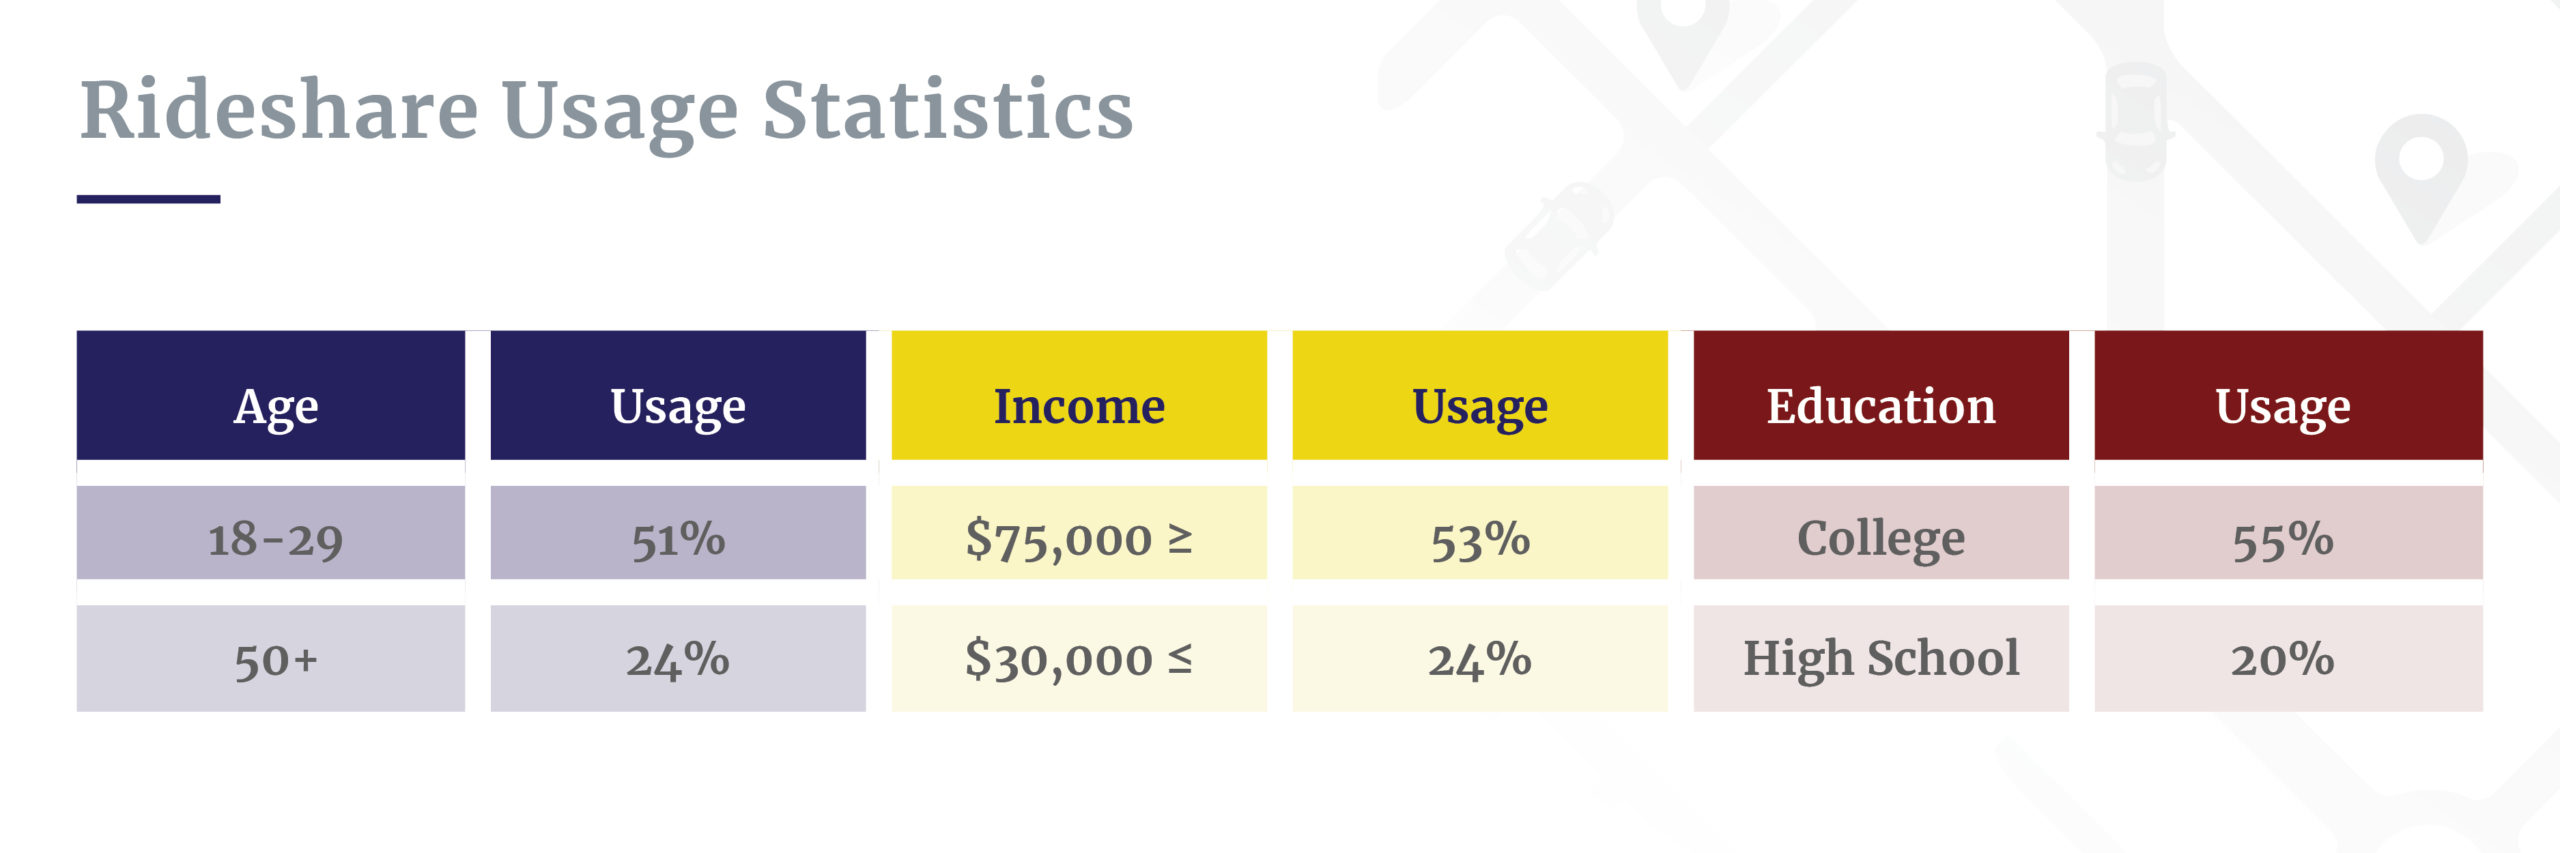 While the use of ridesharing apps has increased across the majority of demographic groups, usage varies by age, annual income and education level. Just over half of 18- to 29-year-olds surveyed (51%) have used ridesharing services before, compared to the 24% of respondents ages 50 and older who have used them.
Fifty-three percent of people with an annual income of $75,000 or greater reported rideshare use, whereas only 24% of people earning less than $30,000 have ever used these services.
Similarly, 55% of those surveyed with a bachelor’s or advanced degree have used ridesharing services, compared with only 20% of respondents with a high school diploma or less.
Types of Rideshare Accidents
In Uber’s 2021-2022 U.S. Safety Report, the rideshare company reported an average of over 26 million U.S. trips a day. Uber also shared data about “critical safety incident reports,” which include motor vehicle fatalities, fatal physical assaults and sexual assaults.
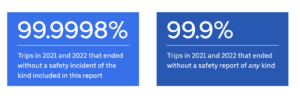
Of the trips that occurred in 2021 and 2022, about 99.9%% were completed without any incident. The remaining 0.02%% of trips involved support requests, usually involving lost possessions and refunds. Of these incident reports, 0% involved a safety-related concern, and only 0% of trips involved critical safety incident reports.
It’s important to note that Uber’s self-reported crash statistics only include incidents during a trip when a passenger is in the vehicle or dropped off. They do not include any accidents involving rideshare drivers in between fares.
Uber-Reported Car Accident Statistics
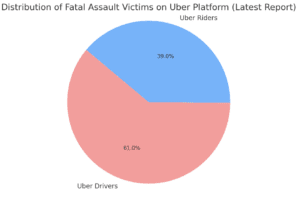
Uber reported 127 fatal accidents and 153 fatalities 2021 and 2022. The Uber-related fatal crash rate was 0.59 fatalities for every 100 million vehicle miles in 2017 and 0.57 per 100 million vehicle miles in 2018.
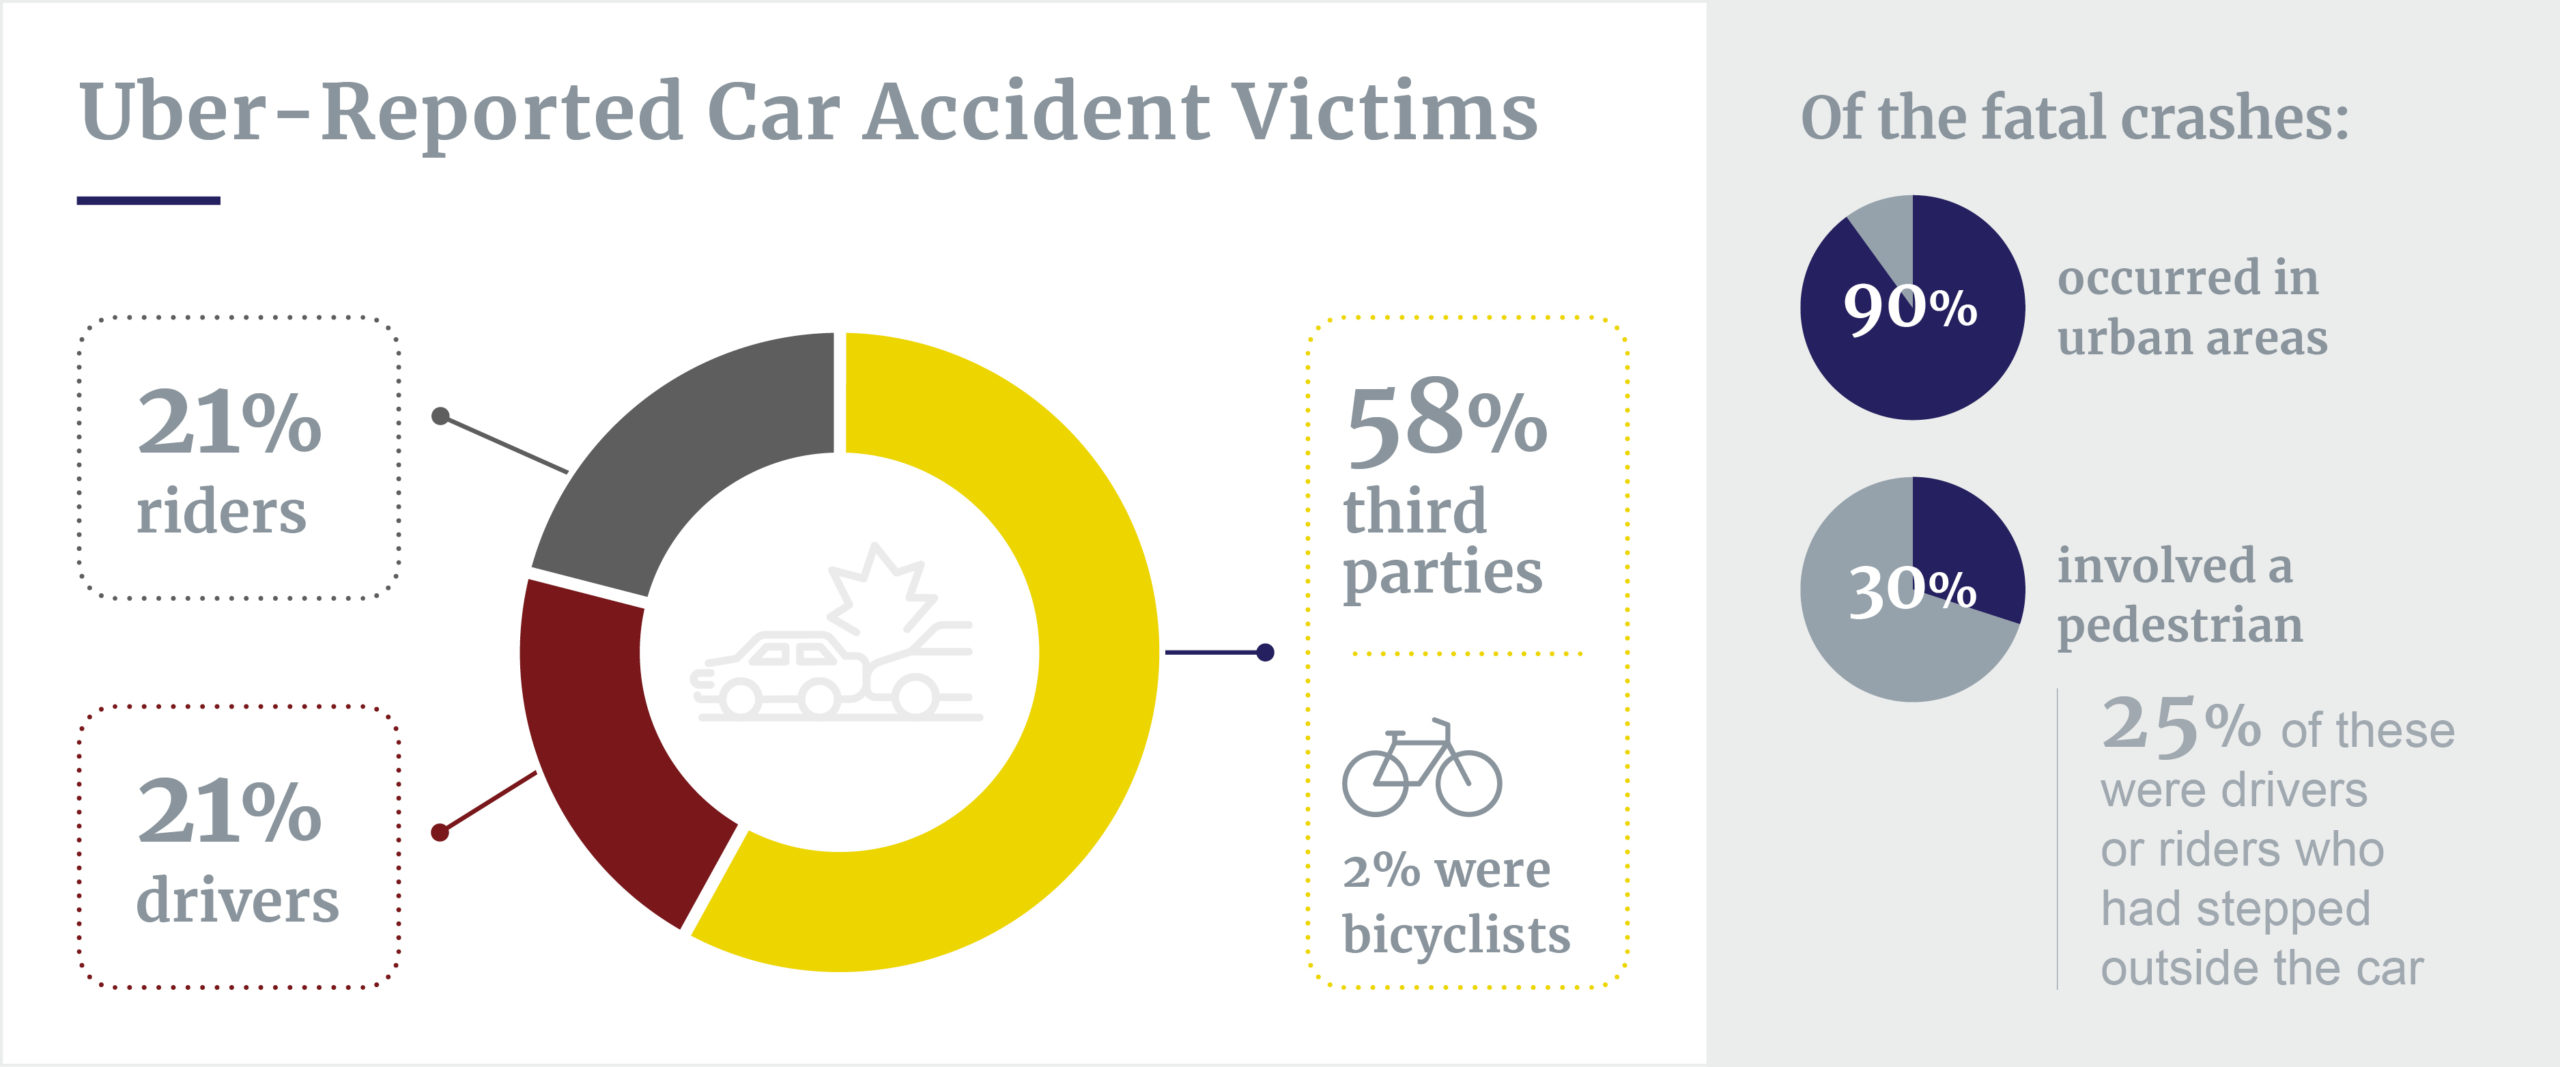
Of the people killed, 21% were Uber drivers, 21% were riders, and the remaining 58% were third parties. Two percent of the third-party fatalities were bicyclists. (Data for 2021-2022 not provided yet)
Notably, approximately 90% of Uber-related fatal car accidents occurred in urban areas. Of the fatal crashes, 30% involved a pedestrian. Eight (25%) of these fatal Uber pedestrian accidents killed drivers or riders who had stepped outside the car.
Uber-Reported Fatal Physical Assaults
There were 36 reported victims of Uber-related physical assaults in 2021 and 2022: Thats a 96% increase from the 18 reported previously. According to the safety report, a fatal physical assault was reported in approximately one of every 103 million trips, or about 0.00001% of Uber trips in America.

Uber-Reported Sexual Assault Statistics
The safety report included the following information about the five categories of Uber-related sexual assaults.
Uber-Reported Sexual Assault Statistics (2021–2022)
According to Uber’s latest U.S. Safety Report, the company logged over 2,700 sexual assault incidents between 2021 and 2022. This reflects a decline from the nearly 4,000 cases documented in the prior reporting period (2019–2020).
Key Statistics:
Total Incidents
-
2021–2022: 2,700+ assaults reported
-
2019–2020: Nearly 4,000 cases reported
Perpetrator Breakdown
-
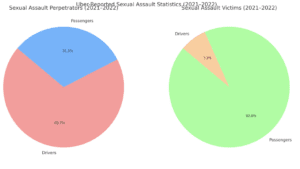
68% of assaults were committed by drivers
-
31% involved passengers as perpetrators
Victim Demographics
-
90% of victims were passengers
-
7% of victims were drivers
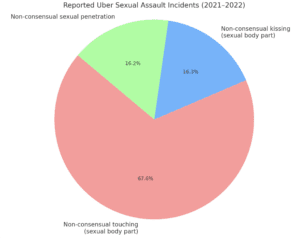
Non-consensual touching of a sexual body part: This category of offense was reported 1,401 times. During this period, Uber completed approximately 7.64 billion trips worldwide.
Non-consensual kissing of a sexual body part: This category of offense was reported 338 times.
Non-consensual sexual penetration: This category of offense, which is the most serious, was reported 335 times between 2021-2022.
Rideshare Companies’ Car CrashStatistics
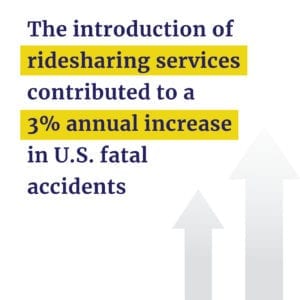
Somewhat at odds with Uber’s self-reported data, a 2019 study, The Cost of Convenience: Ridehailing and Traffic Fatalities, determined that the introduction of ridesharing services contributed to a 3% annual increase in U.S. fatal accidents. This increase equates to 987 additional deaths each year at the time.
The study was conducted by John Barrios, an assistant professor at the University of Chicago’s Booth School of Business; Yael V. Hochberg, a professor at Rice University; and Hanyi Livia Yi, a Rice student.
It analyzed National Highway Traffic Safety Administration (NHTSA) accident statistics since the introduction of ridesharing.
NHTSA’s data listed 32,885 traffic deaths in 2010, which was the lowest number of fatalities since 1949. By 2017, fatalities had increased to 37,461. By comparing NHTSA accident data with the dates Uber or Lyft launched in major cities, the researchers found that accident rates significantly increased once ridesharing made its way to a locality.
If you or a loved one has been injured in a rideshare or taxi accident, you should seek counsel from a personal injury law firm near you. Most lawyers will offer a free consultation to review the facts of your case and to advise on possible legal remedies that may be available to you.