Data from federal research shows how common workplace injuries are, which workers are most at risk, and how much they receive in worker’s comp.
The federal government has created laws guaranteeing workers in the United States the right to a safe work environment. Your employer is legally required to eliminate general health and safety hazards, and promote workplace safety.
However, even when employers take all the appropriate steps to maintain occupational safety, workplace accidents can still occur. On-the-job injuries can cause severe damage and are sometimes fatal.
This article will examine statistics regarding the numbers and types of workplace injuries in the U.S. and some interesting data regarding the cost of workers' compensation claims. More statistical data regarding work-related injuries is available through the Department of Labor at bls.gov.

Notable Work Injury Statistics:
- Just under 3.5 million nonfatal workplace injuries were reported in 2019.
- In 2018, 5,250 people were killed by work injuries, including 1,008 construction workers.
- The most common workplace injuries in 2019 were sprains, strains, and tears.
- Injured workers received $62.9 billion in workers' compensation benefits in 2018.
Workplace Injury Statistics in 2019
According to the U.S. Bureau of Labor Statistics' (BLS) Survey of Occupational Injuries and Illnesses Data, employees and contractors reported nearly 3.5 million nonfatal workplace injuries and illnesses in 2019. This amount has held steady from the year before.
BLS also reports that 888,220 of the occupational injuries and illnesses that occurred in 2019 were severe enough to require the worker to stay home from at least one day on the job to recuperate.
The following industries reported the highest injury rates:
Here's more detail on the above numbers:
- Trade, transportation, and utilities: 789,100 injuries, 22.6% of total reported
- Educational and health services: 613,800 injuries, 17.6% of total reported
- Health care and social assistance: 575,200 injuries, 16.4% of total reported
- Manufacturing: 421,400 injuries, 12.1% of total reported
- Retail trade: 395,700 injuries, 11.3% of total reported
- Leisure, entertainment, and hospitality: 345,100 injuries; 9.9% of total reported
Construction worker injuries and fatalities are some of the highest of any profession.
Types of injuries causing higher rates of missed work:
| Type of Injury | Cases | % of Serious Injuries | % of Total Injuries |
| Sprains, strains, tears | 295,180 | 33.2% | 8.4% |
| Soreness, pain | 157,440 | 17.7% | 4.5% |
| Fractures | 85,710 | 9.6% | 2.5% |
| Bruises, contusions | 80,640 | 9.1% | 2.3% |
| Cuts, lacerations | 72,110 | 8.1% | 2.1% |
Musculoskeletal injuries are common for office workers, but fatalities are comparatively uncommon.
Workplace Injuries by Age Group
BLS reports that over 60% of workplace injuries requiring time off the job were sustained by workers between 25 and 54. This number is slightly lower than the percentage of the workforce composed of people in this age range. Workers ages 25 to 54 comprise 64.1% of workers age 16 and older and incurred 61.3% of these injuries.
We've listed the more detailed information about nonfatal occupational injuries that forced the worker to stay home by age demographic in the chart below.
Workplace Injuries By Age Group:
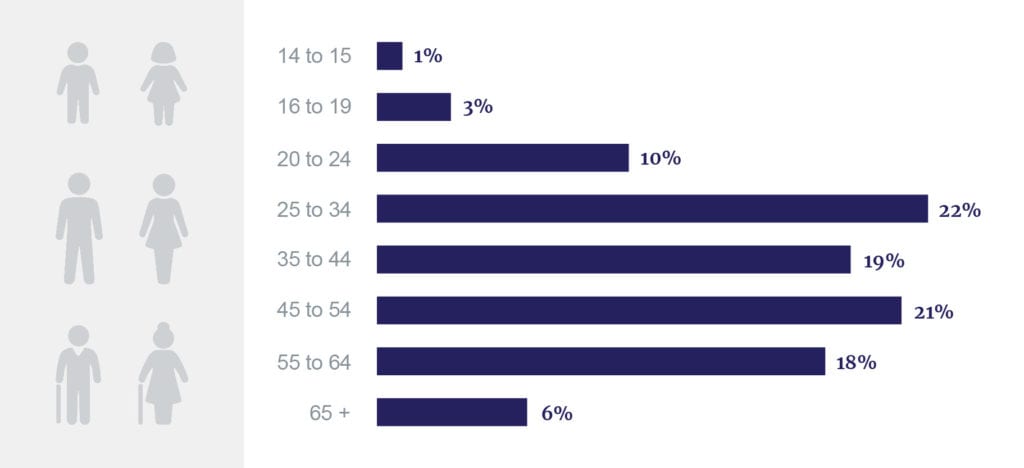
Here's more data on the numbers above:
| Age Group | Number of Injuries | % of Total Injuries | % of Workforce |
| 14 to 15 | 220 | 0.02% | Data Unavailable |
| 16 to 19 | 25,530 | 2.87% | 3.27% |
| 20 to 24 | 85,800 | 9.66% | 9.00% |
| 25 to 34 | 189,310 | 21.31% | 22.73% |
| 35 to 44 | 170,280 | 19.17% | 21.03% |
| 45 to 54 | 184,850 | 20.81% | 20.34% |
| 55 to 64 | 163,570 | 18.42% | 17.07% |
| 65 and over | 47,430 | 5.34% | 6.57% |
| Total | 888,220 | 100% | 100% |
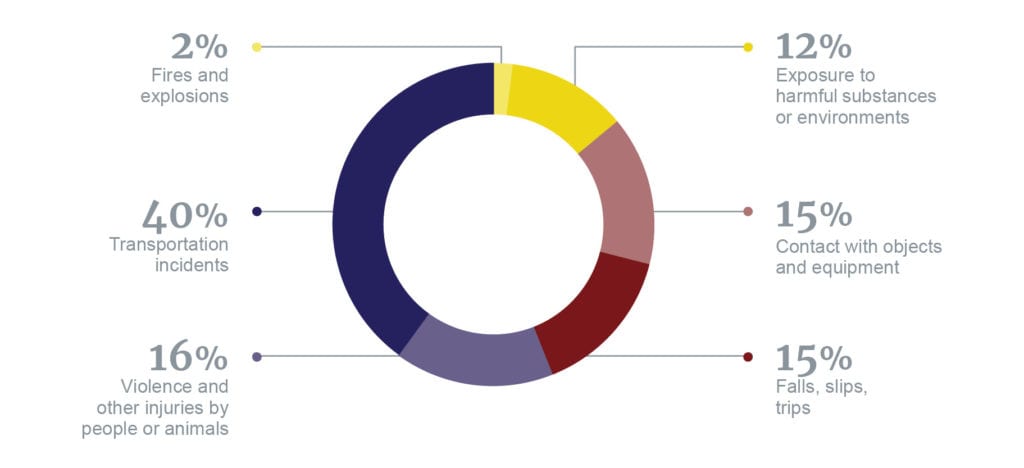
Fatal Workplace Injuries
The BLS also reports data regarding workplace fatalities in its Census of Fatal Occupational Injuries (CFOI). According to the CFOI, 5,250 people died in 2018 as a result of workplace injuries.
Causes of fatal work injuries:
The CFOI also identified the following industries as having the most fatal workplace injuries in 2018:
- Trade, transportation, and utilities: 1,379 fatal injuries, 26.3% of total deaths
- Construction industry: 1,008 fatal injuries, 19.2% of total deaths
- Natural resources and mining: 704 fatal injuries, 13.4% of total deaths
- Professional and business services: 585 fatal injuries, 11.1% of total deaths
- Manufacturing: 343 fatal injuries, 6.5% of total deaths
- Leisure and hospitality: 253 fatal injuries, 4.8% of total deaths
Workers' Compensation Insurance Claims
Workers' compensation is a type of insurance system that provides financial benefits to workers injured on the job. Typically, these benefits are awarded on a no-fault basis, meaning that the employer does not have to be legally liable for the worker's injury to receive payment.
According to data compiled by the National Academy of Social Insurance, approximately 142.6 million U.S. jobs and $8.2 trillion in wages were protected by workers' compensation in 2018. This is a 1.6% increase in covered employment and a 5.0% increase in covered wages from 2017.
Some jobs are becoming more automated. This may have a positive effect on the rate of on-the-job injuries. Robotic replacements can prevent injuries and save human lives.
The total amount of workers' compensation benefits paid in 2018 was $62.9 billion, a decrease of 1.2% from 2014. However, when this amount is adjusted for the increase in the total wages protected by workers' compensation, the comprehensive benefits paid decreased by $0.16 per $100 of covered wages since 2014.
In 2018, the cost of workers' compensation to employers was $98.6 billion, which is just over a 5% increase from 2014. Yet, when adjusted for the increase in covered wages, employer costs were only $1.21 per $100 in covered wages, a decrease of $0.16 (12.2%) from 2014. This data shows an overall decline in the cost to employers in recent years.
If you have been injured on the job and accept workers' compensation benefits, you forfeit your right to sue your employer for their part in your injury.
If you believe that your employer or someone else was at fault for the accident that hurt you, you should consult with a personal injury attorney near you before agreeing to accept workers' compensation.